
In Marketing Cloud there are many different ways to create reports and analytics on a wide variety of topics. The capabilities are so diverse that we’ll be covering these capabilities over several blog posts.
Reporting on Engagement
In this blog post our focus will be reporting on engagement which is the usual goal when evaluating Journeys. From senior leadership to sales you’ll have parties interested on those classic engagement stats like number of sends, opens, clicks and more.
in this blog we’ll cover your reporting options in two areas:
(1) Standard out of the box engagement reports
(2) Custom reports leveraging the two Journey Data Views
A third and powerful option is also Marketing Cloud Intelligence which we will dedicate a separate blog altogether.
I. Standard Out of the Box Engagement Reports
Marketing Cloud has two, but essentially one stock report in the Analytics Builder tab to provide basic engagement reporting. If you are starting out creating journeys this option will be a good choice for you.
Pros:
(1) These reports are easy to run and get an immediate and total picture of all journeys
(2) If you need to customize your journey report, you can select specific journeys and save the report for quick and easy reporting at anytime.
Cons:
(1) There is limited options to customize the report. You can add Journeys but only by name vs communication or activity.
(2) You can’t suppress out test records which can cloud your reporting.
(3) These reports only offer KPI stats and there isn’t flexibility to add or remove stats.
Let’s briefly walk through how to leverage this standard report:
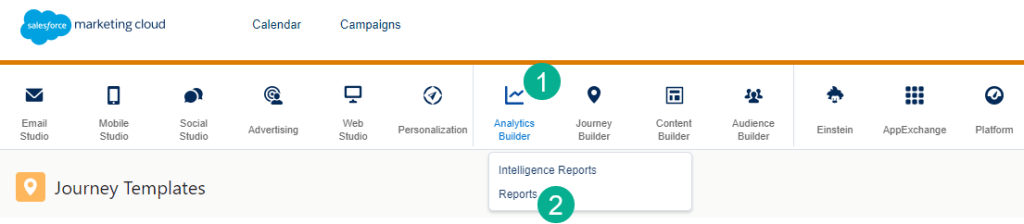
(1) In Analytics Builder.
(2) Click on Reports in the drop down menu.
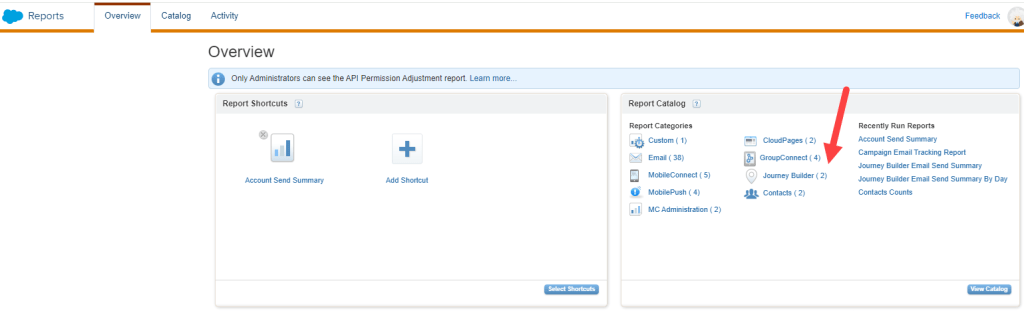
Click on the Journey Builder link in the Report Catalog.

(1) We typically will use the top report “Journey Builder Email Send Summary” unless you have a use case to report by day.

(1) Clicking into the report you have a few Report Parameters to select. The first is Date Range which can be customized, a lot of flexibility here.
(2) In the Journey window you can select “ALL” journeys or individual journeys.
(3) The Versions window can be helpful limiting the versions to only running or finishing to prevent null reporting on stopped versions.

(1) If you select a single journey.
(2) You can select a specific version
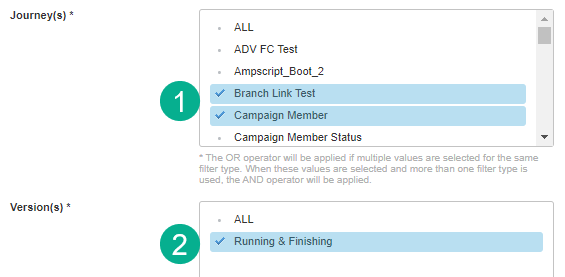
(1) If you select multiple journeys.
(2) The individual version option goes away.

For our purpose let’s select all the Lead Nurture Journeys and All Versions for the last 30 days.
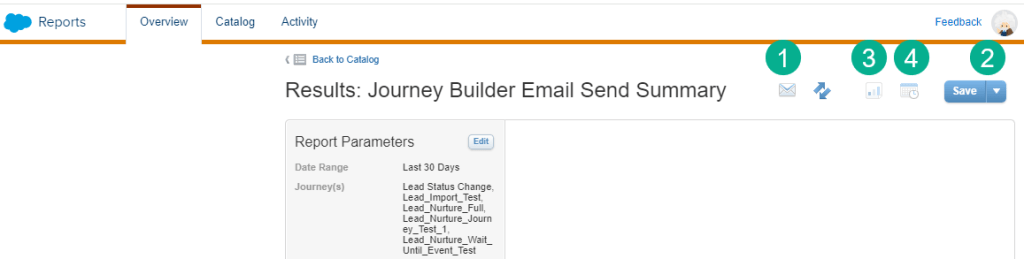
(1) Once you hit submit you can email the report to any email address.
(2) You can save the report so it comes up in the Overview page.
(3) Once saved you can run a snapshot of the report which will down load an excel file to your browser.
(4) And you can schedule the report to be sent to you on a regular basis.
Let’s take a look at the report that gets generated.
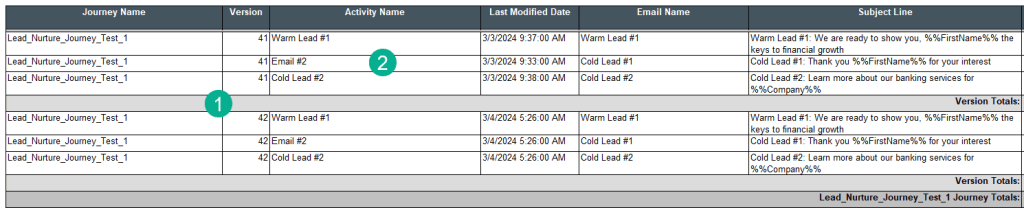
(1) Right off the bat you get a lot of information and it can be handy that each journey version is broken out and totaled separately.
(2) As well as each email activity is detailed.
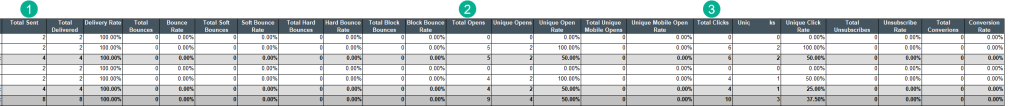
(1) The stats provide is pretty comprehensive including Sends.
(2) Opens.
(3) And Clicks.
In addition it’s nice to see bounces as well. Conversions are also provided, but not sure where that KPI comes from as it could be related to the journey goals.
In summary the stock reports are a quick and easy way to get basic stats on your journeys. If the lack of customization and limitation on the format and data provided in the reports works for you these reports can be an excellent option.
II. Custom reports leveraging the two Journey Data Views
If you require a little more flexibility to your reporting, creating custom reports leveraging the two Journey Data Views is the best option.
Pros:
(1) These reports can be full customizable, serving up specific journeys and the required KPIs.
(2) The data will be created in a Data Extension which can be leveraged vs an Excel file.
(3) Exposure to the Journey Data Views will get the team comfortable with the back end data which can be useful in problem solving Journey issues.
Cons:
(1) You need to be comfortable with SQL, but you don’t have to include complex SQL coding to produce high quality reports.
(2) Data View data only goes back 180 days. This can be solved if you capture Data View data on a daily basis which will allow you unlimited history.
To start let’s take a closer look at these Journey Data Views. Navigate to the Salesforce Data Views documentation page: https://help.salesforce.com/s/articleView?id=sf.mc_as_data_views.htm&type=5

(1) The Journey Activity Data View connects to the standard engagement data views like Open, Click, etc.
(2) And it connects to the Journey data view.
(3) The documentation guides you identifying the field to connect the Journey Activity data view to the other engagement data views: “JourneyActivityObjectID corresponds to TriggererSendDefinitionObjectID”
(4) Here’s details on the TriggererSendDefinitionObjectID field.
(5) The VersionID field will be used to connect Journey Activity to the Journey data view.
Connecting the Journey data view brings in the valuable data that will drive the custom reporting.
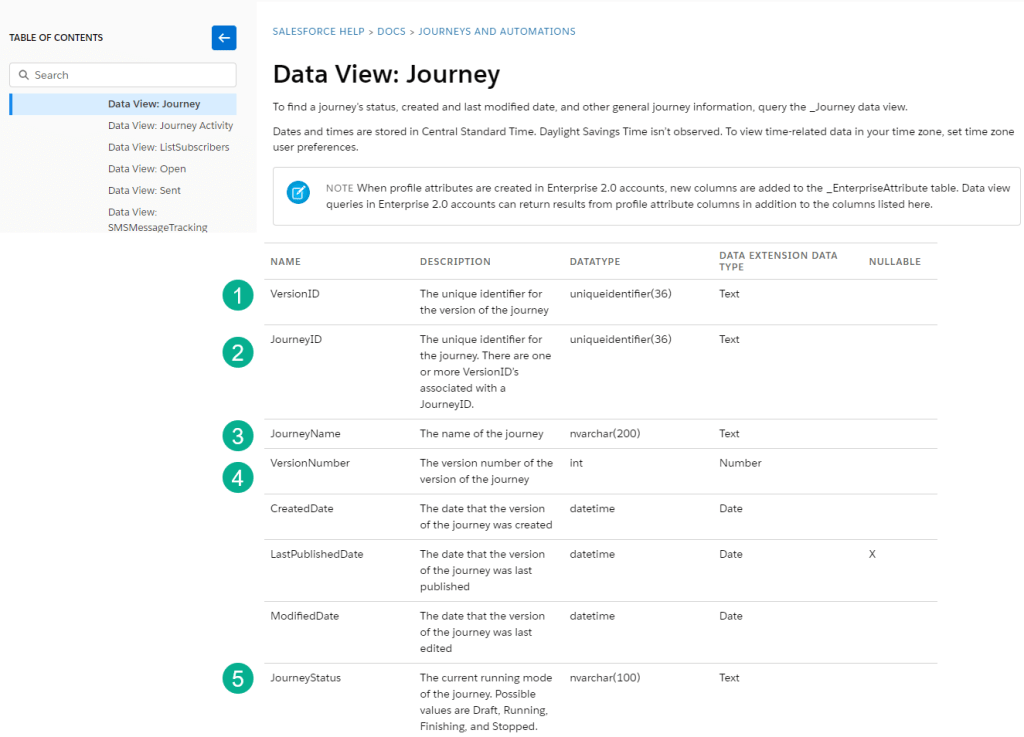
(1) VersionID connects Journey to Journey Activity.
(2) JourneyID identifies each particular journey.
(3) Journey Name, (4) Version Number and (5) Journey Status will be key data fields in the custom reporting.
Let’s pull together these two data views in a starter query to populate your custom data view based report.
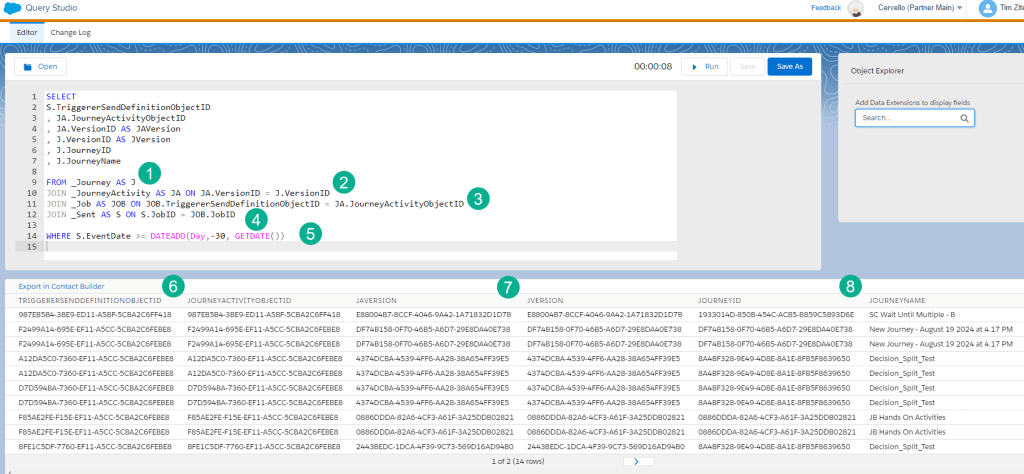
(1) In our FROM statement we’ll start off with the Journey data view.
(2) And connect it to the Journey Activity data view using the VersionID.
(3) You could connect it directly to an engagement data view, but we recommend including the Job data view as it can bring in valuable data. Again we are connecting the Journey data views using the TriggerSendDefinition and the JourneyActivityObjectID (“JOB.TriggererSendDefinitionObjectID = JA.JourneyActivityObjectID”)
(4) And last bringing in the Sent data view to populate total sends.
(5) In our WHERE filter we’re looking back the last thirty days. There’s a lot of flexibility in the DATEADD functionality to choose any range that suits your use case.
(6) When starting out utilizing the Journey data views it can be helpful to output the TriggererSendDefinitionObjectID and the JourneyActivityObjectID so you can validate these two data points equal each other.
(7) And same for the JourneyID. As you can see above in both instances the id for both variables match each other.
(8) Once the connection is made correctly that opens up the data to create customized reports to fit any use case.
Now let’s modify the query to Group those sends so we can tabulate send by Journey ID.

(1) In the FROM statement we’ll be adding the _Subscribers data view (https://help.salesforce.com/s/articleView?id=sf.mc_as_data_view_subscribers.htm&language=en_US&type=5) which will allow us to leverage the email address.
(2) And in our WHERE statement we can suppress those test records to prevent inflated counts in your engagement metrics.
(3) Using the Group By function.
(4) We can create a JourneySends variable to be populated in our data extension which produces a count of sends.
You can add this Send query, modify it using the _Click data view (https://help.salesforce.com/s/articleView?id=sf.mc_as_data_view_click.htm&type=5) and so on to add different engagement metrics according to your use case.
You can create a data extension that will be updated along the way as it travels through each query in the automation:

(1) In the Data Extension you can start by writing the Sends.
(2) Then add the clicks associated to each Journey.
(3) And populate the Journey ID and Name to help identify each Journey.
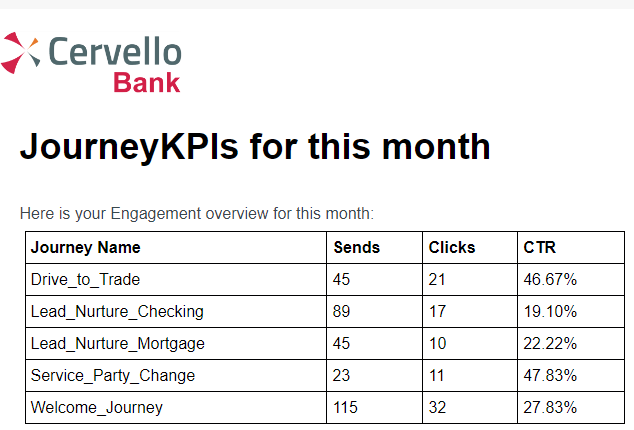
Now that this data is in a data extension and is automatically populated at whatever interval makes sense to your team you can display the data in a Marketing Cloud email:
In summary – take your time developing your reporting
If you are just starting out the out of the box reports are a great way to start. But start getting familiar with the Journey data views right out of the gate as well. Maybe not for reporting, but validation or trouble shooting issues.
In our next blog we’ll showcase some additional reports that you can create leveraging the data views. Please share any journey reports you use frequently.

Leave a comment