
Everyone is interested in reporting on engagement and the all important KPI of clicks. There are several ways to view clicks in Marketing Cloud and this article will cover how you can automate the reporting of clicks in Marketing Cloud by using the amazing Data Views: https://help.salesforce.com/s/articleView?id=sf.mc_as_data_views.htm&type=5
In this article we’ll go over the nine steps to report on clicks in Marketing Cloud:
1.) Review the Data View fields
2.) Find the EmailID for each email to be tracked
3.) Start a query pulling in data via the Job Data View
4.) Use the Sent Data View to Create Send Report by Subscriber
5.) Use the Sent Data View to Create Total Sends Report
6.) Use the Click Data View to Create Click by Subscriber Report
7.) Use the Sent Data View to Create Total Clicks Report
8.) Create Queries to populate the data in a data extension
9.) Use ampscript to populate the report data in the email
Use Case: Why we need to report on clicks
Before we dive into how to automate reporting on clicks let’s talk about the use case as to why you’d want to report on clicks. We’ll use our Cervello marketing automation program as an example. Each week we send out lead nurture emails to prospective clients. At the end of the week we send a summary email of the potential leads to follow up. In that summary email we include overall send and click data. Here’s the actual email in Marketing Cloud:

(1) The email in Email Studio
(2) The data extension that includes everyone at Cervello who needs to see our weekly engagement KPIs
(3) We want to see total sends
(4) and total clicks
(5) and calculate our click through rate.
The problem is that we have to manually tabulate the send count, clicks and click through rate each week and want to build in capability to have this be automatically populated in the email.
OUR CHALLENGE:
(1) Can we populate engagement data for all lead nurture emails on a weekly basis
(2) Can we customize our email to automatically pull in these values to report key KPIs to leadership.
Reporting on Clicks – Manually
Before we tackle the automated solution using Data Views, let’s first review how you can view sends and clicks manually in Marketing Cloud as there are some cool ways to view this data.
Using Tracking to view engagement data
Engagement stats are captured for each email send under the tracking tab in Email Studio.

(1) When in Email Studio
(2) Click on the tracking tab and select Sends.

(1) Selecting the type of send – in our case we are using a Salesforce Send to populate our email sends in Sales Cloud
(2) Each email is listed
(3) And summary stats are included as well
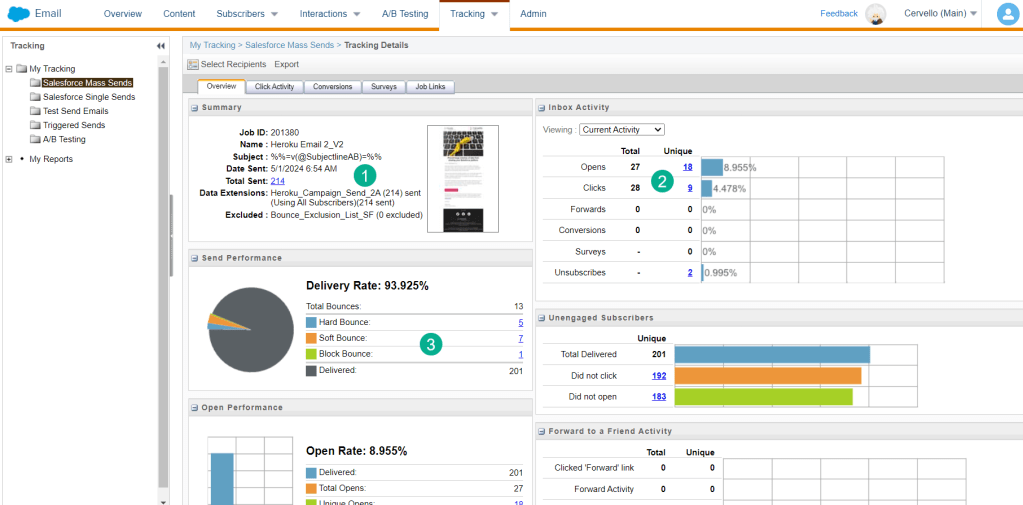
(1) Clicking into each email gives you an incredible dashboard detailing all the key stats for the email send.
(2) Under the Inbox Activity section you can see opens and clicks.
(3) You can even find bounces and overall delivery rate.
Clicking into the Unique click number which is highlighted in blue you can see detailed information about who clicked.

(1) Each subscriber who engaged is a separate row.
(2) Even the linked that was clicked is available.
All this data is amazing and helpful, but the user is left to manually keying in the KPIs into a spreadsheet to calculate the values needed for reporting. Marketing Cloud has reports that will summarize engagement data but most of these are custom and don’t come out of the box.
How to Automate Reporting on Clicks using Data Views.
Data Views offer a convenient way to view those key engagement stats and better yet populate that data into a data extension so that you can automate reporting. Let’s go over the steps of how to report on these key engagement stats in Marketing Cloud.
STEP 1.) Review the Data View fields
For our exercise today we are going to get familiar with the Sent and Click data view. Before leveraging the data it will be helpful to pull up both of these data views to view the available fields. Depending on the level of reporting you may also need the Job or Journey Data Views as well. For our use case we want to identify engagement for specific emails only so we’ll need the Job Data View to make that linkage. Here are the data views:
Job Data View: https://help.salesforce.com/s/articleView?id=sf.mc_as_data_view_job.htm&type=5
Sent Data View: https://help.salesforce.com/s/articleView?id=sf.mc_as_data_view_sent.htm&type=5
Click Data View: https://help.salesforce.com/s/articleView?id=sf.mc_as_data_view_click.htm&type=5
Let’s take a closer look at the fields available on the Click Data View:
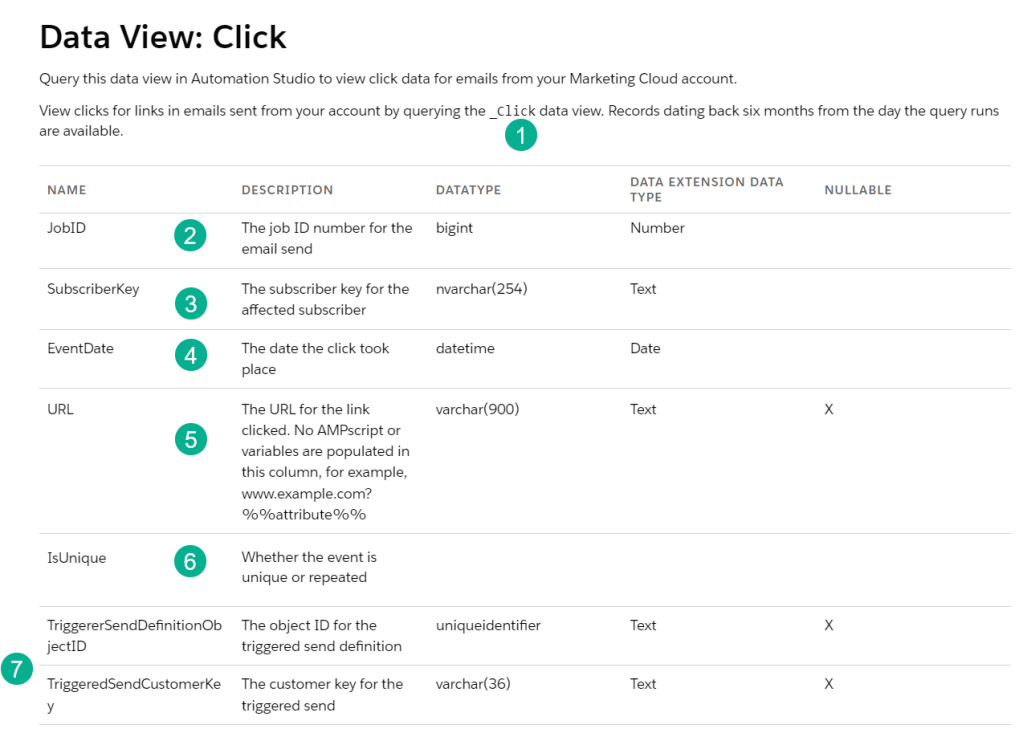
(1) _Click will be how to reference this data when used in a query
(2) JobID will be helpful to link the click to the JOB Data View to link it to a specific email
(3) SubscriberKey is that unique key that identifies a subscriber in Marketing Cloud
(4) EventDate is the date and time when the click occurred
(5) URL is the exact url where the user clicked, very helpful to see which click the subscriber engaged with in the email
(6) InUnique is an important flag to help weed out those duplicate or bot clicks
(7) These keys can be helpful to do deeper reporting
STEP 2.) Find the EmailID for each email to be tracked
To report on specific emails it will be helpful to obtain the Email ID for each email to be tracked.

(1) In the properties of the email or before you click to edit the email
(2) You’ll find the Email ID
For our use case we want to track two emails and their Email IDs are 31827 and 32042
STEP 3.) Start a query pulling in data via the Job Data View
If you don’t have Query Studio please add it to your org as it is free and an amazing tool to write queries. Download Query Studio here: https://appexchange.salesforce.com/appxListingDetail?listingId=a0N3A00000FP3yFUAT

(1) In Query Studio add a FROM statement to your query and reference the _JOB data view
(2) In your WHERE clause use the SQL IN function to include multiple EmailIDs. For more information on the IN function click here: https://www.w3schools.com/sql/sql_in.asp
(3) In the SELECT we’ll want to output the JobID which we’ll use to connect to Sent and Click data views and to confirm we’ll also output the EmailName.
(4) In our output we can see the JobID populated, confirm the email name and see there were 9 total sends
Now it’s time to add in the _Sent Data View
STEP 4.) Use the Sent Data View to Create Send Report by Subscriber

(1) Do a Inner JOIN or just a JOIN to the Sent Data View using the _Sent syntax. The Sent and Job Data Views both have the JobID field which you can use to link the two databases.
(2) We only want sends for a particular range. In that case we want to find all sends in the last 7 days using the DATEADD function: https://www.w3schools.com/sql/func_sqlserver_dateadd.asp
– We are using the S.EventDate as our field to compare
– The >= sign is used as we want a date that is greater than or equal to seven days ago
– The DATEADD function has three data points (Time period (Day, Month, etc), Number of time period, and current date)
– The Time Period we are using is a DAY
– We want data from 7 days back so we are using a -7
– To get todays date use the GETDATE() function: https://www.w3schools.com/sql/func_sqlserver_getdate.asp
(3) In our SELECT we want to output the subscriberkey and the eventdate
(4) In our data we can see the data of all sends by subscriber detailing the specific date. This can be saved and used as a report that breaks down subscribers sends by email.
STEP 5.) Use the Sent Data View to Create Total Sends Report
A few tweaks to the query will give you the total sends report.
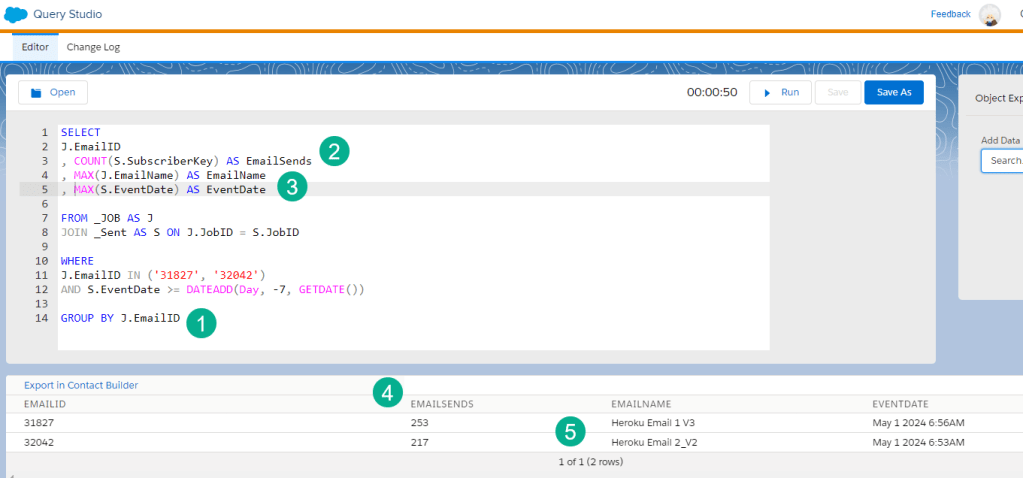
(1) Add a GROUP BY function to summarize the data by the EmailID or unique email: https://www.w3schools.com/sql/sql_groupby.asp
(2) Use the COUNT function to tabulate the number of sends using the subscriberkey value: https://www.w3schools.com/sql/sql_count.asp
(3) When using the GROUP BY function you have to choose either the MAX or MIN of each variable that you output in the query.
(4) In the output we can see the total Sends
(5) Total sends broken down by Email
STEP 6.) Use the Click Data View to Create Click by Subscriber Report
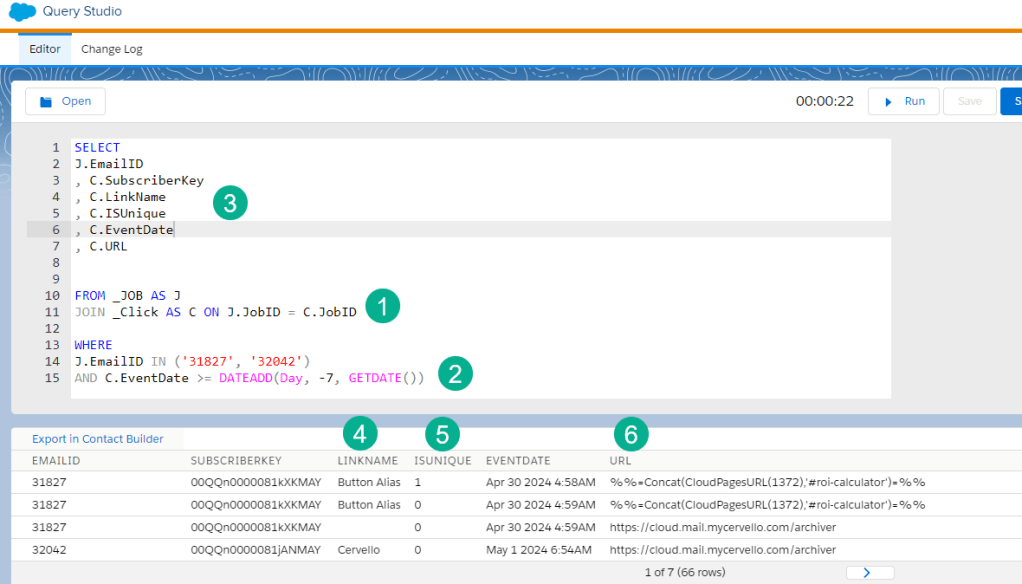
(1) Substitute in the Click (_Click) Data View linking the database to JOB by the same JobID
(2) Same syntax for the EvenDate
(3) We are outputting some very cool and interesting variables in the SELECT statement
(4) The LinkName can be useful to report on specific links clicked in the email. To set this LinkName use the
alias function in HTML to identify the Link Name.

(5) IsUnique is important to filter on as you can see there are several clicks listed that aren’t unique so it’s best to add in the filter to select only those unique clicks.
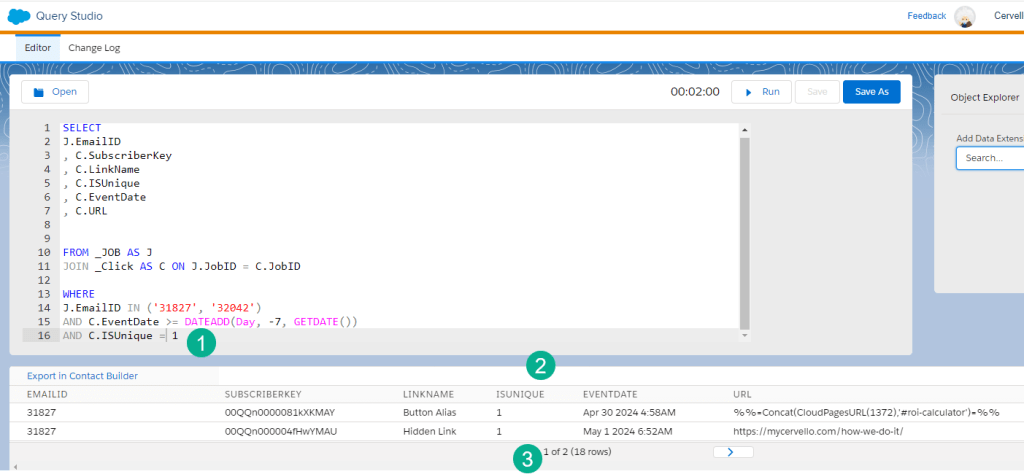
(1) Add a filter in the WHERE clause where ISUnique = 1
(2) Only ISUnique values of 1 will appear
(3) The counts of the email will drop
(6) The URL can be helpful to output and sort to determine engagement by link clicked.
STEP 7.) Use the Sent Data View to Create Total Clicks Report

(1) Add in the GROUP BY function like in the Sent use case
(2) Add in COUNT to summarize clicks by subscriberkey
(3) See the total clicks by email
STEP 8.) Create Queries to populate the data in a data extension
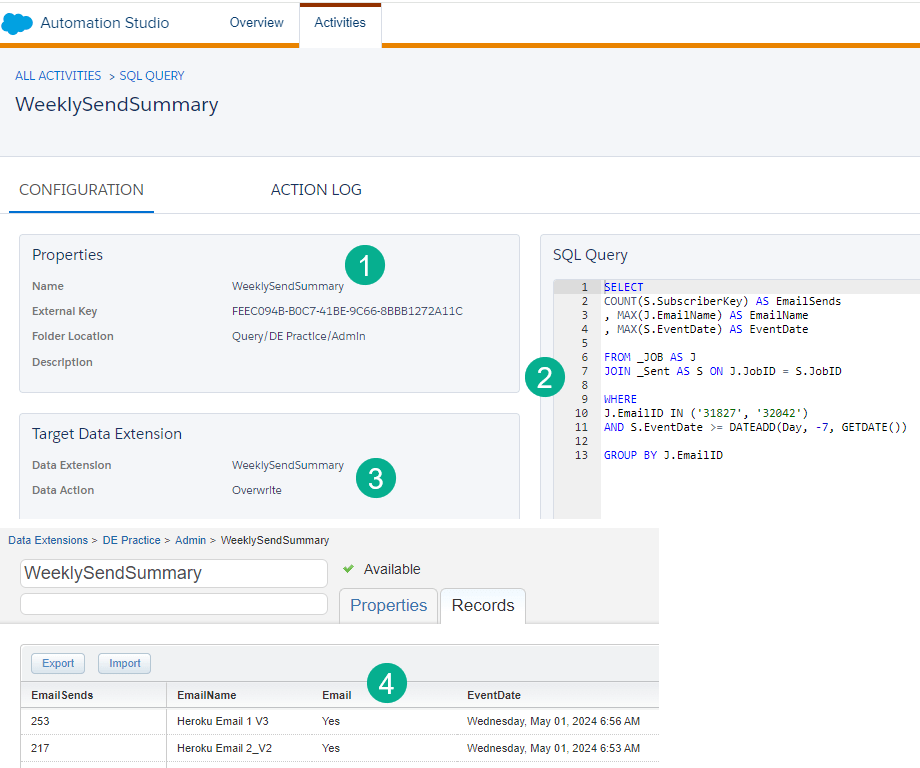
(1) Create and name your query
(2) Drop in the query created in Query Studio
(3) Select the data extension and in our case the Overwrite function will work
(4) Create the data extension and run the query to produce the records viewed in Query Studio. I’ve added a Email field here with the field defaulting to yes to use in the ampscript to pull in each row of data
Here’s the query and data extension for the Click report.

(1) Create and name your query
(2) Drop in the query created in Query Studio
(3) Select the data extension and in our case the Overwrite function will work
(4) Here’s the data populated showing those clicks
STEP 9.) Use ampscript to populate the report data in the email
Now that you have this amazing data in a data extension it’s time to pull it in automatically into your KPI report email.
(1) Edit your script content block where you store all the ampscript
(2) When using a script block to contain ampscript always use a Code Snippet block type
(3) We’re using the LookupRows function to query each send and click data extension looping through each row of data. For more on how to create amazing LookupRows click on this blog post: https://handsonsfmc.com/part-3-lookuprows-function/
(4) As we cycle through each row we are adding up the KPI using the ampscript ADD function: https://ampscript.guide/add/
(5) Same Lookuprows syntax but for the Click data
(6) Adding up clicks
(7) To get our Click Through Rate we are dividing the total number of clicks by the total number of sends and using the ampscript FormatNumber function to format the number as a percentage: https://ampscript.guide/formatnumber/
The end result!

Hurray an automated way to use Data Views to report on clicks and sends in Marketing Cloud!

Leave a comment